2. Legume distribution and biomass
Abstract
: By transect sampling it was found that the 15 legumes species
observed account for ca. 3% of total biomass in August Xiaman
pasture. The most dominant species is Oxytropis kansuensis
(one third of total legume biomass), followed by Astragalus
polycladus, Astragalus sungpanensis and Thibetia
himalaica. Soil moisture and thus temperature seem to have a
marked effect on legume distribution and nodule quality. The
greatest potential for the use of wild legumes is probably dune
revegation.
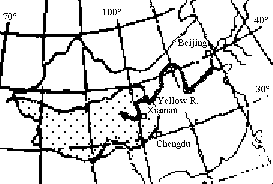
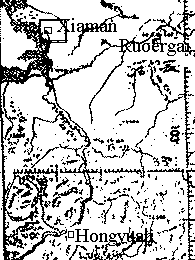
2.1.1. Experimental site: Transects were chosen for crossing different habitats (such as plain, slopes etc.). Transect I was taken on Aug 24 - Aug 26, 1995 (33o34'21"N /102o29'21"E - 33o33'06'N /102o27'56"E, Transect II was taken on Aug 25 - Aug 27, 1996 (33o36'15"N /102o29'09"E - 33o35'36"N/ 102o28'22"E). For both transects a straight NE to SW line was followed by a compass (later corrected for 1.25 degrees SW magnetic declination).
2.1.2. Field sampling: For Transect
I, (a) after each 100m, a wooden 1m*1m frame was randomly thrown on
the earth, (b) the biomass of 0.08 m2 was harvested ca. 2cm above
the earth with a knife or scissors (we sampled two 0.2m*0.2m
squares in the two diagonally opposite corners of the frame), (c)
all legumes 2cm above ground were collected, (d) with a soil corer,
5 soil samples (0-20cm) were taken and mixed, (e) dominant plants
inside the frame were noted, (f) up to ten randomly chosen legumes
outside the frame were dug out and checked for nodulation, nodules
being collected into Eppendorf tubes, the average nodule color
being reported as 1 for white, 2 for slightly pink or chestnut, 3
for dark-pink,legumes herbarized. Furthermore, for Transect I,
after each 50m (in between the samples), the legume species found
in 1m*1m were noted. To check the validity of the overall pattern
of Transect I, this experiment was repeated the following year on
another hill slope (Transect II), but the experiment was simplified
in that only steps (a),(b) and (e) were performed and for (f) only
one nodulated legume per occuring species was chosen in a nonrandom
manner.
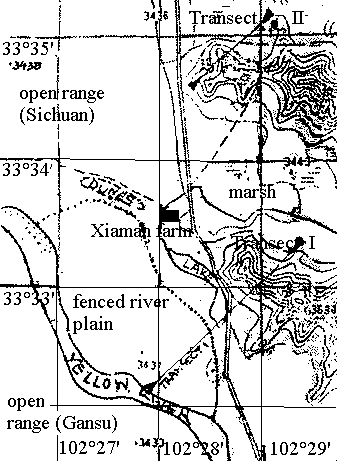
 Collecting
nodules (Long Zhang, me, Yang Zongxin)
Collecting
nodules (Long Zhang, me, Yang Zongxin)
2.1.3. Biomass and nodule treatments: (g) collected wind-dried biomass was oven-dried at 80oC for 24 h (preparatory experiments had shown that the difference between 12h and 24h oven-drying is already less than 3%), (h) rhizobia were isolated from nodules (see chapter 4).
2.1.4. Soil analyses: (i) pH
measurements were performed by pH paper and glass electrodes. The
available nitrogen and phosphorus contents were analysed by Mrs.
Luo Ying at the Soil Analysis Lab. of the Mountain Research
Institute, Academia Sinica, Chengdu. She used the sodium
hydroxide-boric acid method ("Soil Chemical and Physical Analysis"
1980) for determining rapidly effective nitrogen and the hydrogen
sodium carbonic acid digestion (Nanjing Soil Institute Standard
Methods, 1993, with increased acidity when applying
molybdenum-antimony reagent) for determining rapidly effective
phosphorus.
2.1.5. Plant identification: Herbarized and non-herbarized plants were determined according to a set of ca. 150 specimen collected by Zhang Zhaoqing and determined by Prof. Tan Zhongming in 1993. The legumes were sent to Prof. Xu Langran at the Dept. of Botany, NW Institute of Botany,Yangling,Shaanxi (who,under the direction of #Fu Kunjun (1993) cocompiled the volume Astragalus spp. (Fabaceae) in the Flora Sinica (Vol. 41:1)). Grasses and sedges follow the Academia Sinica (Chengdu) herbarium and the more difficult ones were determined by Prof. Yang Guanghui, author of #Yang. Legume specimen were deposited in the Sichuan Union University herbarium (among the accession nos. 348865-348880,367485-367603). In order to ensure reproducible field identification, a key based on vegetative characters to the common legumes and grasses was made (XIAPLANT.FAB and XIAPLANT.POA). Other plants were liberally identified by a species list (XIAPLANT.ALL) compiled from the published sources listed in section 1.2; however for non-legumes and non-grasses identification below the genus level will often be unreliable, in cases of doubt refer to the specimens collected by Zhang Zhaoqing at Prof. Tan Zhongming, Dept Botany,Sichuan Univ. For the sake of convenience, in the further text, plants are referred to by their binomial names, for more exact names (including publishing author and Chinese name), refer to XIAPLANT.MY.
2.1.6. Area information: Surface
data were obtained from 1:100000 map information, the transect
design having the advantage that it is easy to draw a transect
through two or three landmarks. Slopes are simply calculated as the
sinus of the hypotenuse between two height lines (see PROG_SLO.C). To ease calculations,
negative values were assigned to all northern slopes, and positive
values to their southern counterparts.
2.1.7. Data processing: Data were entered into a FOX database, results from steps (c) and (e) classified as ("yes"/"no") booleans, results from steps (b), (c), (d), (f) and (i) classified as floats. Furthermore ,a parameter "environment" scored low for moist and high for dry high environments on eye observation, however, no soil moisture data were taken. All data were processed by "robust" nonparametric ranking methods: the relations between booleans and booleans were analyzed by chi-square tests with Yates' correction (CH;example: Vicia occurence and Leontopodium occurence; following #Wall 1986), floats were split up into different data groups according to boolean values and processed by Mann-Whitney (MW) rank tests (example: biomass with and without Vicia occurence; algorithms following #Sprent 1989), and floats were compared with floats by Kendall's Tau (KT) rank test (example: pH and biomass; following #Kendall 1946and #Sprent 1989). As by these procedures more than 1,000 tests were possible in each category, an ANSI C program (STA.H,see appendix;the original data are termed DATASET.TRA) processing ASCII-transformed FOX data (#Liu 1994) was made, which, although not definitely 100% error-free, seems to give reasonable results. In the following discussion results selected from raw printouts (RAWPRINT.TRA) below (P<0.05) are marked by one and results below (P<0.01) are marked by two asterisks; the number of pairs sampled is following directly after the test specification for ("KT" or "CH"), for Mann-Whitney ("MW") tests that number is usually 35 and what is give is the number of shared positives.
-----------------------------------------------------------
Table T-2.2-A: Overall environmental data (transect I)
-----------------------------------------------------------
data             average   median    standard dev.
-----------------------------------------------------------
total DM                g/m2      375.8     361.5     181.2
pH                      -           6.85      6.80      0.50
avail.N                 ppm       291.2     336.5     215.6
avail.P                 ppm         4.16      3.65      2.65
legume DM               g/m2        9.80      6.50      7.96
Astragalus diversity    species/m2  0.926     1.000     0.723
legume DM/total DM      %           2.950     2.185     2.734
-------------------------------------------------------------
---------------------------------------------------------------------------------------------------------
Table T-2.2-B: Influence of different environments
--------------------------------------------------------------------------------------------------------
type            tot. DM[g/m2]   leg. DM[g/m2]   rap.avail.N     rap.avail.P     common legumes
---------------------------------------------------------------------------------------------------------
marsh           321[3]          1.8[3]          323[1]          10[2]           Oka(once)
northern slope  322[6]          6.2[6]          334[3]          3.9[3]          Hta,Oka
southern slope  194[2]          7.7[2]          244[1]          3.5[1]          Vam,Thi,Ata(once)
south. half sl. 364[4]          6.6[4]          272[2]          3.2[2]          Thi,Tar,Asu,Apo,Oka
river plain     493[15]         12.1[15]        291[8]          3.3[8]          Oka,Thi,Apo,Ari,Tar,Ama
dune             27[6]          3.0[6]          --              --              Asu,Tla,Tar
---------------------------------------------------------------------------------------------------------
Notes: Number of observations in brackets. Common species (except indicated) occurred at least twice. For the meaning of species acronyms the XIAPLANT.MY.
-------------------------------------------------------------------------------------------------
---------------------------------------------------------------------------
Table T-2.2-C: Legume growth and nodulation (transects I and II)
--------------------------------------------------------------------------
Species                              g/m2  abvgr.g/ind tot.g/ind  ind/m2    nod/m2    nod/g     mg/nod    nodcol  flowering
--------------------------------------------------------------------------
Astragalus mahoschanicus[6]        0.183     0.53    1.07     0.35      0.63      1.72       -          2[2]    VII-IX
Astragalus polycladus[16]           1.680     1.31    3.67    1.28      7.62      1.62       1.29[3]    2.3[6]  VI-IX
Astragalus prattii[28]              0.323     0.15    0.40    2.15      0.61      0.71       0.81[5]    2.0[1]  VI-IX
Astragalus sungpanensis[7]         0.934     2.60    4.57     0.36      1.15      0.70       -          2.0[2]  VI-X
Astragalus tanguticus[1]           0.057     1.00    2.00     0.06      0.00      0.00       -          -       VI-VIII
Astragalus tongolensis[2]         0.026     0.22    0.45     0.10      0.23      4.44       -          1.0[1]  V-VII
Hedysarum tanguticum[12]            0.257     0.11    0.75    2.34      7.39      4.22       -          2.2[5]  VI-IX
Lathyrus pratensis[2]              0.009     0.08    0.15     0.11      0.34     20.00       -          1.0[1]  ?
Oxytropis hirta[3]  -              1.80    3.40     -         -         -          -          1.0[1]  V-VII
Oxytropis kansuensis[58]            2.706     0.75    1.63    3.61     34.11      5.80       0.72[6]    1.44[27]VI-IX
Trigonella archiducis-nicolai[18]   0.149     0.17    0.29    0.88      0.03      0.10       -          1.0[1]  VI-IX
Thibetia himalaica[29]              0.763     0.22    0.92    3.47      2.97      0.93       -          1.44[18]V-VII
Thermopsis lanceolata[10]           0.971     0.78    1.30   1.24      0.19      0.12       -          1.0[1]  V-VII
Vicia amoena [2]                   0.040     0.26    0.70     0.15      0.00      0.00       -          -       V-VII
Vicia cracca[2]                    0.094     0.17    0.47     0.55      0.00      0.00       -          -       V-VII
TOT                                                                    55.27
-----------------------------------------------------------------------------------------------------------------
Note: The number of the observations for all the data is given in brackets following the species designation. If individual data are based on fewer data, a number in brackets is given separately. "nodcol" is nodule color, "flowering" the flowering period.
-----------------------------------------------------------------------------------------------------------------
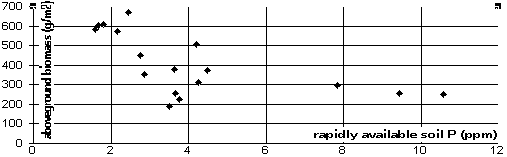 Inverse relation of rapidly available P to total
biomass
Inverse relation of rapidly available P to total
biomass
2.2.1. Relation of rapidly available soil nutrients to grassland productivity: rapidly available phosphorus and biomass are inversely related(**P<0.0012,KT17),the inverse relationship of alkali-digestable N to biomass is much more loose (P<0.13,KT17).
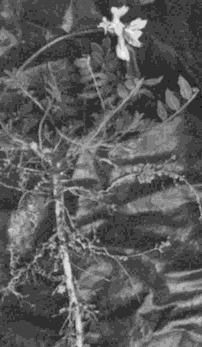 Oxytropis
kansuensis with white nodules
Oxytropis
kansuensis with white nodules
2.2.2. Legume overall distribution &
nodulation: The percentage of legume DM/total DM is positively
related to environmental dryness (*,KT) and slope
(P<0.08,KT);the positive relation of Astragalus spp.
DM/total DM and slope is even more pronounced (*,KT). But in
absolute figures, the total legume DM is higher on the fertile
riverbank than on the slopes (**,KT). A number of 55 nodules/square
m2 has been inferred, the majority belonging to Oxytropis
kansuensis. Nodules from xerophilic legumes tend to be redder
than those from moisture-tolerant legumes.
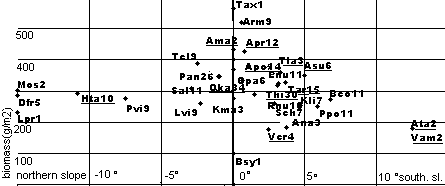 Diagram 2.2.-A Distribution of plants according to
environmental parameters, acronyms see XIAPLANT.MY. Legumes are underlined.
The number following the acronym is the number of observations.For
numerical data see PLANDIST.HTM
Diagram 2.2.-A Distribution of plants according to
environmental parameters, acronyms see XIAPLANT.MY. Legumes are underlined.
The number following the acronym is the number of observations.For
numerical data see PLANDIST.HTM
2.2.3. Astragalus distribution
& nodulation: Among the 15 legumes found in our transect
experiment, the Astragali display most diversity (6 species
is a conservative estimate). From diagrams D-2.2-it can be seen
that the Astragali dominate in dry and fertile habitats,
Astragalus diversity is high in habitats where Kobresia
maquensis and Trigonella archiducis-nicolai can be
found(*,MW7-10). With the increase in diversity, Astragalus
biomass also tends to increase (P<0.1,MW7-10), and it is
significantly higher than in Leotopodium
longifolium-dominated meagre meadows(*,MW6). Astragalus
diversity is slightly related to the occurence of Thibetia
himalaica(*,KT) and Trigonella archiducis-nicolai, which
have a distribution over the plain as well as southern slope.
Inside the genus Astragalus, the sparsely distributed
Astragalus mahoschanicus and the more common Astragalus
prattii and Astragalus polycladus prefer fertile dry
plains and southern slopes (their distribution being loosely
related to Bupleurum commelynideum;P<0.1,CH), whereas
Astragalus sungpanensis and especially Astragalus
tanguticus are found in dryer habitats and on southern slopes.
Inside the genus, nodule color seems to improve with environmental
dryness (eye observation, not backed by solid statistics) and
Astragalus sungpanensis is the legume that most often occurs
on disturbed habitats (wayside slopes and dunes) and might be
valuable for revegetation uses. On steep and thus moist northern
slopes (slope >10o), the rare Astragalus tongolensis has
been found only once.
2.2.4. Oxytropis distribution
& nodulation: The single most abundant species with the
widest distribution is Oxytropis kansuensis, and its biomass
comes close to to the combined amount of the astragali. As many
plants reach the flowering stage (petals are bright yellow), to a
casual observer it is also the by far most conspicuous legume. On
the dry plains, its habitat overlaps with the astragali, but is
occurring less in Anemone rivularis dry meadows (*CH). It is
also able to colonize moister habitats (wetter grasslands,northern
slopes), although the marshlands are devoid of legumes (this
distribution boundary roughly coincides with Leontopodium).
Its nodules account for 61.7% of all legume nodules inferred from
the collected data. Most of the nodules appear to be white and the
average color sampled is even worse than most astragali. Relative
nodulation (nodules/g DM) is lower on sites where astragali
dominate (*,KT).On steep southern slopes (where Oxytropis
kansuensis will not be found), Oxytropis kansuensis's
relative Oxytropis hirta will sometimes be found, but it is
not very dominant among the other legumes.
2.2.5. Hedysarum distribution
& nodulation: Steep northern slopes form an environment
that has a most distinguished community: A glance on diagrams and
D-2.2-A shows that these are dominated by mosses, Carex
sp.,Dasiphora fruticosa, Polygonum viviparum and the
legume Hedysarum tanguticum. Hedysarum tanguticum is
exclusively confined to northern slopes (or closely adjacent
regions) and can be easily recognized in the field. As it is a
plant with a colossal taproot, nodule counts will probably largely
understimate actual nodulation.
2.2.6. Thibetia distribution
& nodulation: The only plant with a distribution and an
abundance as wide as Oxytropis kansuensis is Thibetia
himalaica (note that this under-researched endemic Himalayan
[for example,#Allen & Allen 1981 do not even mention the genus]
has changed names frequently, see XIAPLANT.MY), and its distribution is
somewhat symmetric to Oxytropis kansuensis: being widely
distributed on the dry plain and southern slope. Although the
assumed total biomass of this tiny herb is more than half of
Oxytropis kansuensis, more than three fourths are
underground. Its distribution comes close to that of a number of
other xerophiles (Roegneria nutans, Kobresia maquensis,
Astragalus prattii, Astragalus sungpanensis, Trigonella
archiducis-nicolai and Polygonum potaninii,each *CH).
There is weak evidence that relative nodulation (nodules/gr DM
biomass) is positively related to the occurence of Potentilla
potaninii (*,MW35). Actual nodulation is probably grossly
underestimated.
2.2.7. Other legumes: Other
drought-loving plants are Trigonella
archiducis-nicolai,Thermopsis lanceolata and the vetches. As
these plants (and Astragalus prattii) form wide ramets in
the soil, in table T-2.2-C grams per individual will be under- and
on individuals/m2 will be overestimated. Furthermore, as excavation
is not very convenient, the very low nodule counts for these plants
in that same table are underestimates. Although less extreme than
Astragalus sungpanensis, Trigonella
archiducis-nicolai and Thermopsis lanceolata and Vicia
cracca grow well in disturbed habitats.
2.2.8. Relation between soil nutrients
and nodulation: Available P and total nodule numbers of the
specimen form a weak relation (P<0.105,KT17). Furthermore,
available N forms a positive relation between the abundance, weight
and total nodule number of Oxytropis kansuensis
(P<0.08,P<0.055,*P<0.032;KT17). On the other hand,
relative all species nodulation per sample (calculated as
sum(log(nodules/(plant DM*coefficent)))for nodules>0 and plant
DM>0);the coefficient being the expected average nod/gr. DM
biomass from table T-2.2-A) is inversely related to the available
nitrogen (P<0.0068,KT17).
2.2.9. Soil pH: The soil pH measured
measured by pH paper from the Shanghai Reagent Company No. 3
(5.0-6.0) is about 0.5-1 pH units lower than the glass electrode
values (6.0-7.5) in Xiaman. As soil acidity below (pH=6.0) can be a
limiting factor to rhizobia such as S. meliloti, we repeated this
measurement (with ca. 30 samples) in three labs. To resolve the
issue, two samples were sent to Prof. Ji Guoliang (Soil
Biochemistry Lab,Academia Sinica Soil Institute, Nanjing), who at a
(1:2.5) dilution measured soil acidity to be 6.35 (glass electrode)
and 5.8 (pH paper) and believes the glass electrode data to be of
higher reliability.
2.2.10. Methodology: When working
with 4 people, it took about 50-60 minutes to collect all field
data as described in 2.1.2 for a sample plot in transect I, the
most time-consuming step being to collect all legume biomass on
0.5m2 and to dig out 10 legumes. If these two steps are omitted the
time needed can be reduced to 30-40 min./plot. The sampled total
biomass area (0.08m2) is much lower than what is recommended in
most textbooks (for example #Jiang
1988recommends 0.25-1.00m2), but seems to give reasonable
results.
Note: for a comprehensive discussion on soil pH see section 3.3.3., for the influence of soil nutrients on plant growth and nodulation patterns see sections 3.3.4. - 3.3.6.
2.3.1. Statistical relevance: Be aware of
the fact that among 100 relations between random data five will
appear to be of a P<0.05, one will appear to be P<0.01.
Furthermore, not all statistically significant relations
necessarily imply direct causality:For example, Astragalus
diversity is very closely related to soil pH (**P<0.006,KT35),
but this doesn't have to mean that Astragalus is very
sensitive to (mild) acidity: The relation of soil pH measured by a
glass electrode is very close to the environment type
(**P<0.002,KT35),i.e. higher in dry environments and lower and
lower in moister environments. This difference is caused by the
higher evaporation in dry environments, so that cations accumulate
near the surface. Thus it might rather be the dryer (than the
slightly more neutral) environment that enhances the growth of
different Astragalus species.
2.3.2. Total biomass and total legume
biomass: the total dry matter biomass of transect I was
375.8g/m2, which translates into 3.758 t DM/ha, the second transect
only had an average biomass of 2.087 DM t/ha. This is probably due
to the fact that transect II crossed open range exclusively,
whereas half of transect I was the fertile sandy fenced riverbank.
For instance, for even less productive Ruoergai peatlands #Yang and Jin 1993 report mere 1.35-1.5t
DM/ha.
The aboveground legume biomass in late August accounts for 2.95%
of the total biomass, which is probably a normal value for
grasslands, #Zhang Xiaochuan
(1989) being sceptical on the role of legume BNF estimates
legume content to be "most times less than 5%, sometimes below 1%"
in natural grasslands. It should be noted that end of August (the
recommended time for collecting rhizobia) is not very "objective" -
legumes reach their peak values right in this time,usually a bit
later than the maximum for most grasses (in late July-early August;
#Yang and Jin 1993). After
their late peak, some legumes wilt faster (to store most of their
energy in the tap roots even accounting for more than half of
August biomass) than the grasses, for example an observation on
Oct.30-Nov 1,1995, found most legumes to have wilted, disappearing
most completely were Hedysarum and some Astragali.
According to maybe too hasty data, we then determined green legume
biomass to have shrunken to some 0.09% of total biomass. This is
definitely a gross understimate, but illustrates to what degree of
inconspiciousness the legumes had withered by that date. Only on
the dune site, Astragalus sungpanensis was still green and
active.
2.3.3. Diversity and habitat
dependence: An astonishing diversity of legumes (15 species)
has been sampled on a total area of 87 square meters investigated.
This is far more than for example the three species reported by
#Prevost (1987) or four species reported by #Roizin (1959). The
overall distribution patterns of transect I experiment seem to have
been confirmed by transect II experiment (see again diagrams
D-2.2-A & B). A casual (1-hour) observation of the next hill
southwards to Hongyuan (ca.100km south of Xiaman) also seems to
confirm the distribution pattern (observed: Oxytropis
kansuensis, Hedysarum tanguticum and Thibetia himalaica
on northern slope, Vicia unijuga, Astragalus tanguticus,
Thibetia himalaica and Vicia cracca on southern slope.)
It seems that their widely overlapping habitats are mainly
dependent on soil texture, irradiation and resulting differences in
soil moisture (as these hills are only 100-200m high, differences
in precipitation are not very likely). The preponderance of legumes
in dryer habitats is probably caused by the enhanced heating at
sunshine periods and better aeriation (which also showed beneficial
in a field vetch cultivation experiment, sect. 3.2.2.). Note how
much soil temperatures depend on soil texture: In August, #Dickore 1991 measured a temperature
of -4oC at 6:00am and 32.5oC at 1:00pm on a 4750m altitude Carex
haemotophylla-Oxytropis chiliophylla grassland and -2.7oC at
6:00am and 55.5oC at 1:00pm in a Tibetan desert. The observation
that legumes are preferentially found in dry habitats and that at
Xiaman the nodule color of legumes is best ("reddest") in dry
habitats strongly suggests that competitive rhizobial N fixation is
indeed temperature-dependent. Although temperature changes are
definitely not that violent at Xiaman, higher peak soil
temperatures and thus longer optimal nitrogenase utilization times
in dryer habitats seem to enhance legume growth.
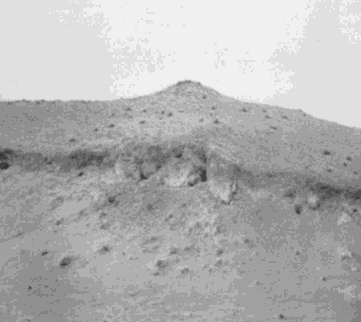 Dunes at Xiaman: some
of the dark spots (green on the yellow dune) are...
Dunes at Xiaman: some
of the dark spots (green on the yellow dune) are... 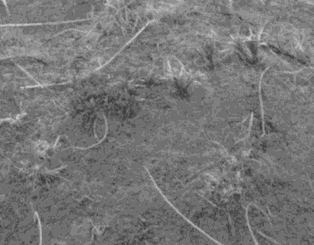 Astragalus
sungpanensis!
Astragalus
sungpanensis!
2.3.4. Potential value of Astragalus
sungpanensis for dune revegetation: Northwest of Xiaman
farm there are some dunes (see map M-1.1-A), and the area affected
by desertification is estimated to be 900ha in Xiaman village and
4200ha in whole Ruoergai county (Ruoergai local TV broadcast, Nov
4, 1995). For these Ruoergai dunes, #Yang Dingguo (1992) reports an increase
from 1100ha in the 1970s to 3000ha in 1992 and #Wu (1994) attributes grassland
deterioration mainly to overgrazing and considers the whole county
(altogether 2.17 million sheep units, mostly yaks and sheep) to be
32.19% overgrazed, Xiaman village to be 98.13% overgrazed . If
something will be done to revegetate these dunes, including some
sand-resistant legumes ought to be considered. On a minitransect
sampled on November 1st, 1995 (length: 250m, total area sample
6m2,see the samples numbered "D" in DATASET.TRA), we found 3.04g legume
biomass/m2 which in absolute values is less than in the plain but
accounts for 11.66% of total aboveground biomass (more than three
times the ratio for the other transect). The non-legume biomass
were primarily unidentified grasses (one of them pretty close to a
specimen of Roegneria melanthera var. tahopaica in the SUU
herbarium), the legumes (besides Trigonella
archiducis-nicolai and Thermopsis lanceolata)
Astragalus sungpanensis (reference specimen has been placed
to the SUU herbarium). Taking into account that legumes are
frequently included in revegetation programs (#Crochett and Becker 1976#Skeffington and Bradshaw 1980#Kenny and Cuany 1990) and grow
well in primary successions (#Johnson and Rumbaugh 1986 #Bishop and Chapin 1989 #Blundon and Dale 1990), it will be
worth trying to include this legume, whose major deficit however is
that it probably very slow-growing and thus not amenable to fast
publication of research results.
2.3.5. Distribution of potentially
poisonous legumes: Even the most common legumes have poisonous
side-effects if digested in unnatural amounts (#Liner 1982), but
usually they are not very serious. However, Oxytropis spp.
and some Astragali are an exception, many species being able
to cause locoism (an intoxication of cattle which ate Astragalus
and Oxytropis species). After a long period of walking in dark, its
mechanism was finally linked to the alkaloid swainsonine (#Molyneux 1982). On the
Qinghai-Tibet plateau (Lhasa area), Oxytropis kansuensis
(remember: that dominant legume in our transect experiment), O.
ochrocephala have been determined to contain 0.021% and 0.012% of
swainsonine respectively (#Lu Xike
1993), and #Zeng (1995)
reports O.glabra to be poisonous. However, the swainsonine
content is a bit lower in the Astragalus strictus
(0.006%,#Lu Xike 1993) and can be
removed by soaking of the plant in water for two days. Other
astragali shown to contain swainsonine are A.
leucocephaloides and A. ridigulus. The field
observations however improved the first eye-view impression (with
Oxytropis being so dominant) and showed that a considerable
portion of legume biomass consists of potentially less harmful
Astragali, Thibetia and Trigonella.
Among the legumes, Oxytropis is quite definitely
poisonous and it might be interesting to to set up a biocontrol
against Oxytropis and/or some Astragali. Weevils
(Curculionidae,Coleoptera) are quite specific natural enemies of
many astragalinae (#Karasev
1995). There are recent reports that Astragalus
mollissimus and Oxytropis sericea have been controlled
by weevils (Cleonidius trivittatus) in the USA (#Pomerinke 1995 #Thompson 1995).
On the other hand, it might be possible to exploit these plants
for pharmaceutical uses: This is an idea Prof. Du (Academia Sinica,
Xining) casually uttered while chatting about the Oxytropis "pests"
in Qinghai province. With great interest we subsequently discovered
that there are indeed some reports on medicinal swainsonine (which
has recently been produced synthetically, #Zhou 1995) use against cancers in the
newer literature (#Olden
1991#Das 1995).
If indeed many of these plants are plants are poisonous, then
this could mean that only the sparse vetches, Trigonella
archiducis-nicolai, the totally unresearched Thibetia or
Hedysarum are left as potential indigenous legume crop
fodder candidates. Of these, the genus Hedysarum is most "showy".
However, though another Hedysarum species is successfully
applied in Inner Mongolia (#Liu
1991), an arctic species was once proposed as a fodder plant in
arctic Canada (#Bassendowsky 1989), and own
observations confirm Hedysarum to be well-nodulated on a
4.500m a.s.l. mountain ridge south of Heishui, considering the
above/below-ground biomass ratio (T-2.2-C) of this genus, we must
conclude that Hedysarum is of no value as winter forage.
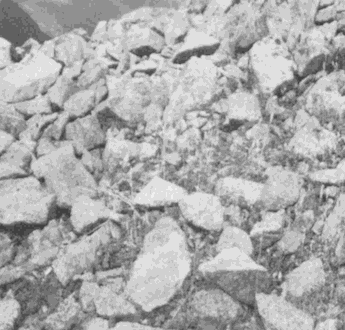 Well-nodulated
Hedysarum tanguticum on Heishui mountain ridge, 4500m
a.s.l.
Well-nodulated
Hedysarum tanguticum on Heishui mountain ridge, 4500m
a.s.l.