 Diagram D-3.2-A: Relation of potassium phosphate (kg per
ha, horizontal abscissa) on nodule weight (g FW per 10 vetch
plants, vertical abscissa)
Diagram D-3.2-A: Relation of potassium phosphate (kg per
ha, horizontal abscissa) on nodule weight (g FW per 10 vetch
plants, vertical abscissa)"Mozilla/3.01Gold (Win95; I) [Netscape]">
3. Soil nutrients and fertilization experiment
Abstract: Vicia sativa was treated with native rhizobia and
chemical fertilizers. Although rhizobia treatment lead to an
increase in the root crown nodules, due to plant autoregulation of
nodulation, it neither increased total nodule numbers, total nodule
mass or plant biomass. The nodulation biomass showed proportional
to plant biomass. Of chemical fertilizers, only potassium
dihydrogen phosphate, but not urea or mild liming, showed effective
on the riverbank.
3.1.1. Experimental field: The experimental field is right on the Xiaman farm (for characterization see section 1.2; its position is roughly at 33o33'20"N /102o27'45" on sandy mixed grassland soil, i.e. the soil layers are well differentiated, the brown humus layer has a depth of depth 30-50cm, organic matter content is 3-5%, total nitrogen content is 0.25-0.5%, slightly acid: pH 5.0-6.0 acc. to pH paper, 6.0-7.4 acc. to glass electrode). The field has been plowed for several years, the surrounding natural plant cover is an Elymus nutans meadow (#Liu 1994). In two previous years the crop on the experimental field was oat.
3.1.2. Experimental design: After tractor plowing on May 17th, 1995, we used the secondary orthogonal rotated combination design (#Chen 1986) for four factors on five levels (i.e. 0%, 25%, 50%, 75%, 100%), altogether 36 randomly distributed plots. With this design, we made two repeats: the first using urea as nitrogen source, the second using rhizobia. As furthermore, in the surrounding area we arranged some single factor plots (levels always 0% and 100%) for additional control, we altogether had 88 plots. Of these plots, 36 were dug up higher than the other plots. A control experiment with oat instead of vetch was included for the urea fertilization.
3.1.3. Plot treatment: Every plot was 1.11m (NS dir.) * 1.8m (EW dir.), equaling 2 square meters. Between plots receiving different chemical treatment we left 0.5m, between plots receiving different rhizobial treatment we left 1.5m. On May 17th (humid weather) we applied lime, micronutrients, potassium and phosphate and dug it under the surface. The following day seed lines were drawn (distance 0.25m between two lines, length 1.8m and on the 19th (humid climate) we have sown 16 grams of Vicia sativa seeds soaked overnight (9.1 grams when unsoaked, i.e. 123 seed/m2). On June 15th urea was sprayed onto the designated plots.
-----------------------------------------------------------------------------
Table T-3.1-A        full amount of fertilizers
------------------------------------------------------------------------------
Factor         kg/ha pd/mu   origin, notes
------------------------------------------------------------------------------
Rhizobia broth 31.25  4.2    4.4*10E12cells/l, mixture of 15 separately
                             fermented strains of native rhizobia (#Zeng 1994; DATASET.RHI)
Nitrogen       84    11.2    urea(Sichuan Chemical Plant),applied on June 15
Phosphorus     75    10      KH2PO4 (Chengdu Chemicals Ltd.)
Potassium      94    12.5    as above; or (single factor) as KCl
Lime          750   100      Jinmapai, Leshan
Micronutr.Mo    4     0.53   5kg/ha Na2MoO4.2H2O+3.7 kg/ha (NH4)6Mo7O24.4H2O
          B     2     0.27   10.5 kg/ha H3BO3
          Zn    0.2   0.027  0.88 kg/ka ZnSO4.7H2O
------------------------------------------------------------------------------
3.1.4. Applying rhizobia: When
sowing, 12.5 ml of pure broth were diluted to 25ml
with water, and mixed with the seeds, sown into the rows and
immediately covered with soil.
3.1.5. Harvest: From Aug. 19-22 we collected the crop from a 1 * 0.5m strip (cutting 2cm above ground), determined fresh plant and nodule weight as well as nodule numbers on site. Collected material was wind-dried for several days and then oven-dried at 65 oC for 24 hrs.
3.1.6. Noting nodule location: #Corbin (1977) published a nodule scoring system. Based on this idea, we noted the nodules of the root crown (the upper 5cm) and the far roots (the rest of the root system). When harvesting and collecting nodules we had no idea of the previous treatment of the randomly distributed plots
3.1.7. Soil analysis: Soil was collected 0-20cm deep, each pH measurement sample consisted of 4 mixed subsamples, the element contents were analyzed by Mrs. Luo Ying at the Soil Analysis Lab. of the Mountain Research Institute, Academia Sinica, Chengdu (see section 2.1.4.). The neutral potassium acetate determination (Nanjing Soil Institute Standard Methods, 1993) was used for rapidly effective potassium.
3.1.8. Mathematical analysis: For assessing the significance of the data (DATASET.FER) with the classic Student's T test, linear regression and the F test two C programs (PROG_TT.C and PROG_LR.C) were written and outputs generated (RAWPRINT.FER). To increase the readability of the results, instead of raw linear regression equations we discuss the differences between the regression equation values for zero and full amounts of fertilizers (see table T-3.1-A). Judging from raw eyes, no gross counterevidence against the linearity of the relations was found.
-----------------------------------------------------------------------------
Table T-3.2-A   Vicia sativa growth parameters
------------------------------------------------------------------------------
                          26 plots w. ident. treatm.       total of 88 plots
Character:                unit         aver.     rel.dev.  aver.     rel.dev.
------------------------------------------------------------------------------
crop freshweight          g/m2         360.2     0.200     371.2     0.352
crop DM (dry matter)      g/m2          74.2     0.178      72.6     0.323
vetch plant DM            g/plant        1.878   0.241       1.828   0.245
root DM                   g/plant        0.0584  0.065       0.0578  0.146
nodule freshw             g/plant        0.1300  0.479       0.1229  0.812
root crown nodules        nodules/plant  1.853   0.190       1.790   0.295
far root nodules          nodules/plant  2.438   0.225       2.223   0.243
compos. yield             see below      -       0.149       -       0.229
weed DM                   g/m2         349.8     0.203     287.5     0.224
------------------------------------------------------------------------------
Note:   The  relative  deviation  has  been  calculated  as  (each parameter value/average value) using PROG_TT.C, so it can be used to compare the deviations of different characters. The most conservative characters (with low deviation) are the area DM, root DM and the composite yield value  ( as area  DM/aver.area DM+plant DM/aver. plant DM).
------------------------------------------------------------------------------
3.2.2. Soil aeriation: Deeper digging up makes the composite yield rise by 10.2% (but P>0.5), and weeds decrease by 28.9% (P<0.02). Because the effect is more significant on the area yield (23.2%,P<0.25) than on the plant individual yield, this might mean a beneficial influence on germination rate (rising by 20.8%,P<0.25).
3.2.3. Mineral fertilizers: Urea
(composite yield +5.5%; soil alkali digestible N rises from 190 to
216 ppm) and light liming (composite yield +5.9%; no marked pH
changes in the humus-rich soil) failed to show significant effects
on either overall crop yield or soil parameters.
In our experiment, the micronutrient application proved harmful to
plants and nodules: composite yield dropped by 20.7%(P<0.1);
especially significant is the root weight dropping by
38.9%(P<0.002); the nodule weight (-23.1%, P<0.5) and nodule
number (+9.3%, P>0.5) were less affected. It might be inferred
that the micronutrients were more harmful to the plants than to the
bacteria.
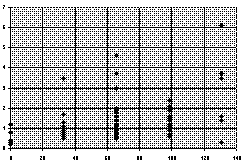
Diagram D-3.2-A: Relation of potassium phosphate (kg per
ha, horizontal abscissa) on nodule weight (g FW per 10 vetch
plants, vertical abscissa)
Relatively efficient was the potassium phosphate: This treatment
made the composite yield go up by 60.0%(P<0.05) and the nodule
weight increased by 146% (P<0.002, D-3.2-A). The latter increase
is mainly due to the fact that the weight of each nodule more than
doubled (+104.9%,P<0.1), whereas the increase in absolute nodule
numbers (+31.0%,P<0.05) is less impressing. Notably, absolute
nodule number increase exclusively relies on the increase in the
root crown nodule number (+97.3%,P<0.01), whereas the far root
nodule number and total plant root weight didn't change
significantly (-7.0% and +3.7%). The increase of weed biomass
(17.8%,P<0.5) induced by potassium phosphate is lower than the
crop biomass increase. In the soil, the rapidly effective phosporus
content increased from 1.1 to 3.6 ppm, the rapidly available
potassium increased from 77 to 128 ppm. To test whether the
potassium dihydrogen phosphate's effect came from the phosphorus or
potassium, in four single plots the full amount of potassium was
applied as potassium chloride, which induced increases in total
number nodule weights and numbers in 62.5% and 36.5%, respectively.
Due to the low number of plots, the increase in the composite yield
value (17.1%) cannot be confirmed as significant, but at least
potassium is an important, or possibly even the most important,
factor.
 Diagram D-3.2-B: Distribution of nodules: horizontal
abscissa is nodule number counted on crown roots of 10 plants,
vertical abscissa is nodule number counted on far root of 10
plants; short vertical rods indicate data pairs for inoculated
plants, rhomboids indicate data pairs for control plants
Diagram D-3.2-B: Distribution of nodules: horizontal
abscissa is nodule number counted on crown roots of 10 plants,
vertical abscissa is nodule number counted on far root of 10
plants; short vertical rods indicate data pairs for inoculated
plants, rhomboids indicate data pairs for control plants
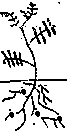 Diagram D-3.2-C: Control plant: nodules on
the far roots
Diagram D-3.2-C: Control plant: nodules on
the far roots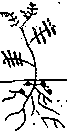 Inoculated: nodules on the root crown
3.2.4. Rhizobial inoculation: We
measured that inoculation lets the composite yield increase by
1.54% (P>0.5), which is not significant at all. But unlike the
above-ground ineffectiveness, underground the inoculation had
extremely visible effects (P<0.0001; see diagram D-3.2-A): The
root crown nodule number increased by 32.7% (P<0.001), the far
root nodulation is simultaneously decreasing by 19.1% (P<0.05).
This shows that the inoculation indeed does enhance early
nodulation in the crown root area, but due to the plant
autoregulation of nodulation (#Caetano-Anolles and
Gresshoff 1991); nodulation in other parts of the root
system is depressed. Consequently, regardless whether fertilizer is
applied, the total nodule mass and number remain fairly constant
(inoculation lets the total nodule mass increase by 8.5% and the
total nodule number increase by 15.4%; but due to the obvious fact
that by occasional root breakages far root nodule counts will be
slightly underestimated we consider even those figures to be
overestimated).
Different native strains becoming dominant seems to be further
side-effect of the inoculation: For example, the composite yield
reaction to potassium phosphate is 2.2 times weaker with inoculated
plants than with the non-inoculated controls. Even more extreme,
liming may rise the composite yield by 68.7%(P<0.05) in the
inoculated plots, but leads to a 33.9% decrease (P<0.25) in the
non-inoculated plots; these opposite effects make the overall
effect of liming seeming insignificant at a first glance.
3.2.5. Biomass-nodulation ratio: In the 88 plots, the nodule biomass was much closer related to plant biomass (F=55.8) than actual nodule numbers (F=0.62), its linear regression equation was nearly proportional (above-ground biomass = 123.82 * dry nodule weight - 0.003 grams). The organ "nodules" thus accounted thus for 0.8% of plant dry matter; in comparison to the human body this is less than the liver but more than the kidneys. The finding that nodule biomass, but not nodule number, is closely related to plant weight implies that well-grown plants have big nodules and poor-growing plants have small nodules (P<0.001).
3.3.1. Productivity: It is evident that the productivity was very low (only 740kg/ha; a return of 183 Yuan or 22 US dollars/ha). This can be explained by a low seeding amount (only 22.5 kg/ha), a low germination rate (32.0%), and, in order to avoid any infection of non-inoculated spots, no weeds were removed which grew out the crop by the factor of 4.7 times (composition: Poaceae 46%, Asteraceae and Chenopodiaceae each 21%), the total plant biomass thus being close to the values reported for wild grasslands in section 3.2.1. However total productivity is higher in an adjacent oat field (4.67T/HA). A good dozen of plots was disturbed by moderate rodent activity. But even under that adverse conditions thanks to the high number of plots some effects of the fertilizers could be differentiated.
3.3.2. Harmful effect of micronutrients: The reason of the harmful effect of the micronutrient dressing was possibly that the amount of molybdenum applied was far too high (#Evans in 1951 also applied rather high rates, but only later we learnt that in recent publications (#Tu 1992) the amount of molybdenum applied now is some 50-80 times lower than in our own experiment) or due to a high sensitivity of nitrogen fixation to minute amounts of zinc (for this effect see #Porter 1981).
3.3.3. Soil pH and liming: As described previously (sect. 2.2.1.) different ways of pH measurement led to conflicting results, which, considering that some rhizobial strains are quite susceptible to acid (sect. 1.3.3.) gives a very unclear picture. In a preceding discussion (sect. 2.3.1.) it has been pointed out that most legumes prefer dryer habitats, which are associated with higher pH. The result that liming doesn't prove effective with vetches as seems to support the conclusion that in Xiaman R. leguminosarum ("vetch rhizobia") nodulation is not limited by pH, but rather by soil temperature. However, among the rhizobia, vetch rhizobia are usually believed to be less acid-susceptible than for example medic rhizobia, so the validity of this conclusion is possibly limited to vetches.
3.3.4. Beneficial effects of phosphorus and potassium on the river-bank: In diagram (D-2.2-C) it has been shown that in the wild grassland rapidly available phosphorus is very inversely correlated to overall biomass production; this seems to indicate that (at least in the end of August 1995) river bank grassland productivity could have been limited by phosphorus. Even if considering that this apparent relation may also well have a P-independent cause (for example, different environments with different soils and thus different N/P dynamics were sampled, #Nadelhoffer 1991) and that P determination in high-organic-matter soils is not very reliable by many methods (#Shao Yuting 1991), the vetch data show a response which is pretty clear. Furthermore, available P and total nodule numbers of the wild specimen sampled in transect I form a weak relation (P<0.105,KT17) and the positive effect of phosphorus on nodule size is very marked in the cultured vetches (sect.3.2.3.).
The fact that potassium and phosphorus show relatively effective
is a common phenomenon in the potassium-rich legumes (#Yang and Zhang in Hongyuan 1995, #Wang and Chen 1992B, #Wang and Chen 1993, #Jin 1994, #Li and Zhu 1993, #Pinkerton 1993, #Dodd 1995, #Peoples 1995A) and is also valid for
the total biomass some Qinghai-Tibet plateau grasslands (#Zuo 1980). As the large-scale
application of mineral fertilizer in the grasslands is economically
and ecologically not feasible, working on phosphorus-fixing
mycorrhiza might be an interesting alternative for microbial
fertilizers. We point out that there is a wealth of literature on
combined rhizobium-mycorrhiza inoculations (#Buttery 1992 (review; of possible
interest for revegetation programs as well); #Hwang 1993 (arctic environment) and
#Lynd 1995).
As a caveat, however, it should be noted that it is also possible
to this fertilizer were caused by some micronutrient contained in
the not very pure potassium phosphate. Although, Mo, Zn and boron
can be possibly excluded, other micronutrients (also amenable for
mycorrhizal programs) could be tried.
3.3.5. Ineffectiveness of nitrogen fertilization on river-bank soil: In transect I, the relation between rapidly available N and P is also close (**P<0.0023,KT17),but the relation of N to biomass is much more loose(P<0.13,KT17), so that the limiting influence of P might be stronger than that of N. Again this apparent relation could be masked by something else, however note that the effect of urea fertilizer isn't very pronounced in oat (6kg of dry matter per kg of urea, P<0.25), the Vicia sativa field weeds (2.3kg of dry matter per kg of urea, P<0.2) and Vicia sativa itself (0.2kg of dry matter per kg of urea, not significant). Although in some arctic (#Ulrich 1978) and alpine (#Bowman 1993) environments biomass production is indeed limited by nitrogen availability, and although #Li (1991) in the Hongyuan area by a soil nutrient dynamic analysis concluded N to be more limiting than P and K, for the Xiaman riverbank soil, #Wang's observation (1994) that on the Qinghai-Tibet grassland N fertilization on nitrogen-rich grassland soils is relatively ineffective (although it may be more efficient in nitrogen poor soils) seems to be valid for comparatively dry river-bank soils. However, nutrient dynamics might be very different in wet sedge meadows (#Nadelhoffer 1991).
3.3.6. Relation of nodulation to N availability and rhizobia availability: the idea of available nitrogen or crown root nodulation suppressing total or side root nodule growth has been discovered very early (#Hiltner 1904) and has been very frequently reported ever since (#Caetano-Anolles and Gresshoff 1991, #Wang and Chen 1992a; in experimental conditions very similar to ours #Egorov 1985). However in our experiment, the influence of urea on nodulation was not marked (root crown -14.2%, far root -14.6%), this of course might also be attributed to the late date of urea application.
It has already been indicated in section 2.2, that in transect I available N forms a positive relation between the abundance, weight and total nodule number of Oxytropis kansuensis (P<0.08,P<0.055, *P<0.032;KT17). Relative all species nodulation per sample (calculated as sum(log(nodules/(plant DM*coefficent))for (nodules>0) and plant DM>0);the coefficient being the expected average nod/gr. DM biomass from table T-2.2-A) is inversely related to the available nitrogen (P<0.0068,KT17). However, this result should be treated with caution: all species nodulation per sample does not contain any considerations on efficiency (such as nodule color), relative all species nodulation per sample is for example also negatively related to Astragalus abundance and the ratio of Astragalus biomass/total biomass (*P<0.05,KT35; *P<0.0143,KT19), which could also be a sampling artifact. Nonetheless, the overall picture emerges that nitrogen doesn't have very marked effects on the nodulation of individual plants, however it might affect overall supraspecies legume distribution.
The occurrence of plant control of nodulation shows that there are already sufficient amounts of rhizobia in the soil able to form pink nodules on vetches and it seems useless to add any more of the same native rhizobia to the soil (although it cannot be excluded that less dominant more effective strains were suppressed by less effective more dominant strains).
3.3.7. The nodulation of different legume (crops) varies markedly: As stated in 3.2.5., the vetch nodule mass is about 0.8% of total DM, and this much higher than that sampled for the wild legume Oxytropis kansuensis, which, if we assume we have sampled only half of the total nodules, has nodules accounting for only 0.1% of legume biomass. For other wild legumes forming even less adhesive nodules, the ratio even becomes poorer, however, it might be largely ascribed to incomplete sampling. Of course, crops grown from seeds will usually have a higher metabolic rates rate/gram biomass (and might thus require more nodules/gram biomass) than wild perennial legumes, but even in sown field trials with Onobrychis viciaefolia and Medicago sativa at Xiaman, the latter had practically no or only minute nodules and the former's nodules are not developed (when sampling 30 five-month-old plantlets, the nodule dry biomass to total dry biomass ratio was about 0.16%, i.e. five times lower than for the vetches).
While vetch nodulation was not overall increased by inoculation experiments with indigenous rhizobia, other crops reported for poorer nodulation (such as Onobrychis(#Duke 1981) grown in the adjacent Ganzi prefecture) might be much more promising. Note that most inoculation research has not centered on the at least on non-acid soils "easy-to-nodulate" vetches, but on the "more-difficult-to-nodulate" legumes such as Medicago (#Shen 1990,#Ning 1995) or Onobrychis (especially Onobrychis has become quite a model organism for Chinese grassland rhizobiologists (#Chen Baoshu 1993, #Wu Le 1995, #Yu Wenle 1995). Actually, we also tried an Onobrychis inoculation experiment, but due to too low germination rates (of seeds we hadn't tested for germination!), no reliable data were obtained.
Notably in Canada's cold environments, #Bordeleau and Prevost (1994)
reported some progress working with Onobrychis and #Nie (1989) had some successes working on
Medicago sativa in Gansu province (West China) under annual
temperatures comparable to Xiaman; however their alkaline
castanozem had a much lower nitrogen content than in our
experimental field. Nevertheless Onobrychis and Medicago might be a
much better choice for inoculation experiments; this is the reason
that after failing in the vetch field trial, we concentrated on
Onobrychis rhizobia and their relation to other wild rhizobia.